
Data Collection Dashboard Visualization Software for Enterprise IoT Large Screens Multi Source Data Reports Private

Related Products
-
 Hart Converter Modbus RTU Tcp Remote Data Collector TCP/IP Integrated Industrial Data Acquisition Device With A/D SamplingUS$ 180MOQ: 1 Piece
 -
Smart Socket US Standard 16A HA Connection MQTT With Charge Statistics 100-240VUS$ 13MOQ: 1 Piece
-
PCMCIA Network Card for FANUC CNC Systems (0iB/0iC/0iD/16i/18i/21i) - Real-Time Machine Status & Data Acquisition, Plug-and-Play InstallationUS$ 150MOQ: 1 Piece
-
Multi-Brand Robot Remote Control & Data Acquisition System - ABB/KUKA/FANUC/Yaskawa CompatibleUS$ 8MOQ: 1 Piece
-
Low-power LoRa DTU Terminal RS485 to LoRa Optional Built-in Battery Wireless Conversion Configurable Power Frequency for Industrial IoTUS$ 160MOQ: 1 Piece
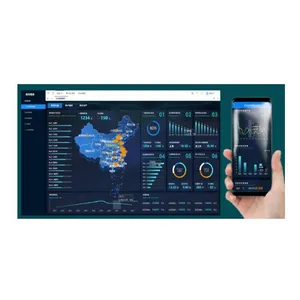
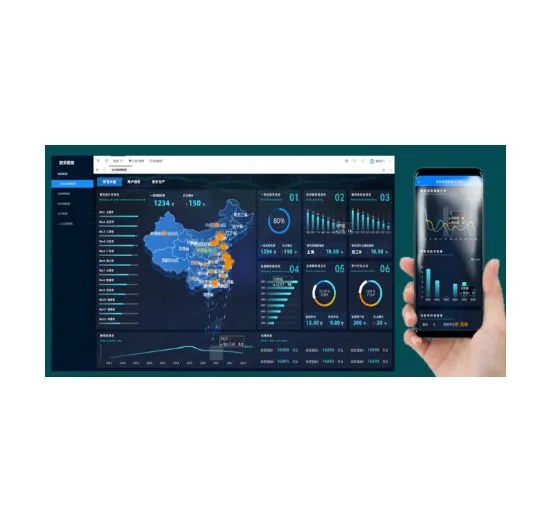
Data Collection Dashboard is a client software tool launched by Shanghai Data Collection IoT Technology that displays data visualization reports on large-screen devices such as Windows and Android. It is a set of productivity tools that can be used out of the box. It can be installed on industrial computers, Android boxes, conference tablets, advertising machines and other devices.
This product can help enterprise users easily implement data visualization for report analysis, data reporting, leadership cockpit dashboards, IoT data display, industrial cloud configuration, company publicity and other scenarios. The product can solve the following pain points: scattered equipment, laborious content maintenance; large-screen equipment is hung high, power on and off, content display and maintenance are difficult; content often needs to be changed or replaced, and manual maintenance is not timely. It is especially suitable for private deployment scenarios.
The product supports importing data files such as EXCEL, CSV, ERP, OA and other system databases, and third-party system data API interface data. You can upload image materials, fonts, audio and video resources, map data, custom-developed pages, etc., and upload them to the data acquisition dashboard software for use. The product supports drag-and-drop layout design, zero-code data binding, dozens of built-in chart components, and supports display terminal devices with different resolutions such as PCs, mobile phones, and large-screen devices .
1 Service ConceptOur company solemnly promises:
You buy not only the product, but also the meticulous and thoughtful technical support service ! ! ! ( =^_^= )
This product only needs ordinary workers to install it on site! No debugging is required!
We provide free remote guidance, remote configuration and debugging services, and send data to the user's designated cloud platform.
Free IoT solution consulting services!
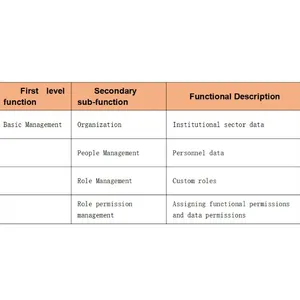
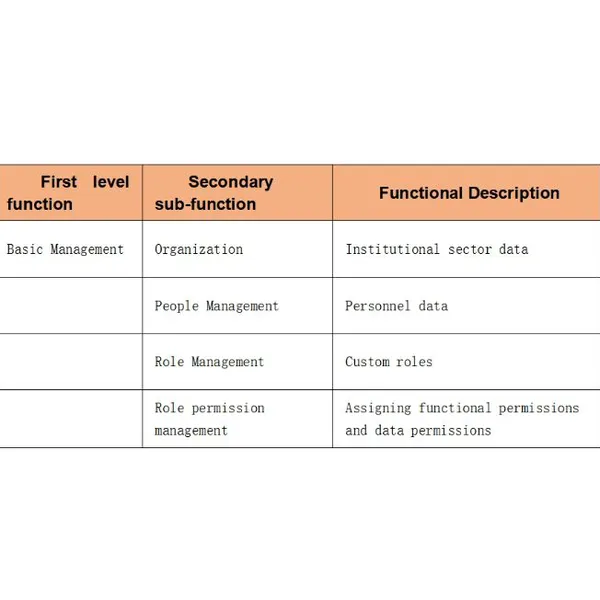
2 Product Features and Advantages
l Drag-and-drop design allows quick response to changing business needs; low-code secondary development allows easy satisfaction of personalized needs.
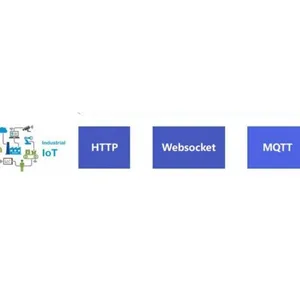
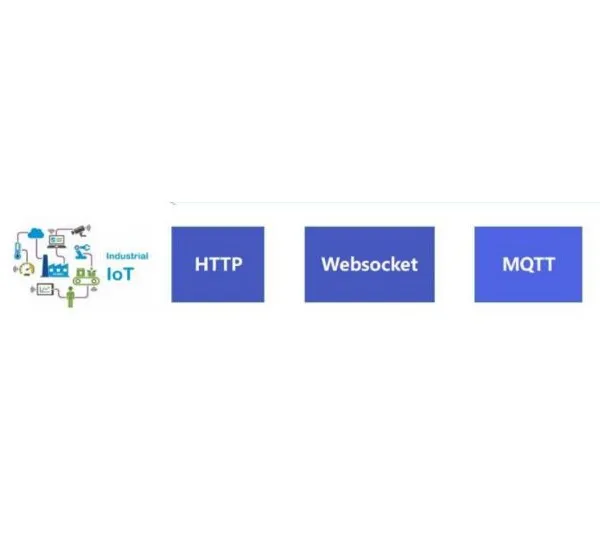
l Rich data sources: relational databases, big data components, data files, external data APIs, the Internet of Things, etc.
l Drag-and-drop design: Flexible combination, design data visualization reports like a puzzle, what you see is what you get.
l Multi-terminal support: Supports designing large-screen visualization for display terminals with different resolutions, such as computers, mobile phones, pads, and splicing screens.
l Configure interaction: Configure to realize click, jump, pop-up window, drill down, chart linkage, data filtering and other interactive needs.
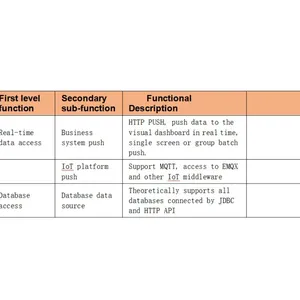
l Report push: fully automatically pushed to enterprise WeChat groups, DingTalk groups, Email, large-screen devices and other channels.
l Intranet privatization deployment: independent control of data security.

Send Inquiry to This Supplier

You May Also Like
-
Maximum Demand Controller Three-Phase Intelligent Power Meter With Fault Recording Harmonic Monitoring RS485 MQTTUS$ 230MOQ: 1 Piece
-
RS485 Non-Contact Rotational Speed Sensor Rotation Monitor for Motors Fans Pumps Modbus RTUUS$ 180MOQ: 1 Piece
-
Temperature Sensor Probe With Digital Display for Production Lines & FactoriesUS$ 115MOQ: 1 Piece
-
485 Modbus Serial to 61850 Converter, Compact Substation Sensor Acquisition Device for Easy IntegrationUS$ 170MOQ: 1 Piece
-
USB to CAN Module CAN Analyzer USB to PCAN Adapter USBCAN Bus Analyzer Debugging Assistant Secondary DevelopmentUS$ 14MOQ: 1 Piece
-
Low Power Consumption Submersible Level Sensor With 433Mhz LORA Communication Open API Secondary Development SupportUS$ 155MOQ: 1 Piece
-
Stable Industrial Lora Wireless Receiver With RS485 Interface & MODBUS-RTU ProtocolUS$ 99MOQ: 1 Piece
-
Multi-Platform LoRaWAN Gateway Long-Range Wireless Coverage for Smart Agriculture/Smart City IoT ProjectsUS$ 150MOQ: 1 Set
-
LoRaWAN IP66 Wireless Air Temperature & Humidity Sensor -40°C~+85°C, 10-Year Battery Life for Precision AgricultureUS$ 150MOQ: 1 Set
-
LoRaWAN IP66 Wireless Light Sensor 0~188000 Lux, 10-Year Battery Life for Smart Agriculture & Environmental MonitoringUS$ 150MOQ: 1 Set


