

Home > Instruments & Meters > Meter for Liquid & Gas > Liquid Level Meter > Sine Image HDTV Universal Test Chart for Camera Transmission Characteristics Testing
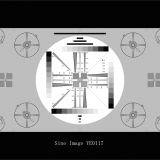
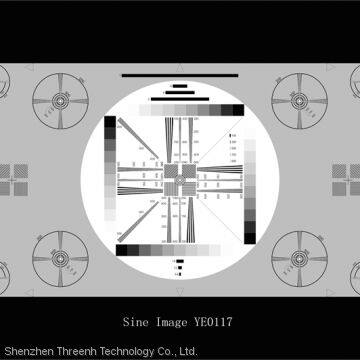
Sine Image HDTV Universal Test Chart for Camera Transmission Characteristics Testing
Negotiable
MOQ: 1 Piece (Price negotiable depending on order volume and customization)
Key Specifications
Get Latest Price
Brand Name:
Sine Image
Place of Origin:
China
Model Number:
YE0117
Payment & Shipping
Payment Methods:
Port of Shipment:
Shenzhen, China
Delivery Detail:
7 days
Related Products
-
 Sine Image YE0188 Transparent SFR Plus Large LVT Film Chart Testing Index MTF/Lateral/Chromatic/Aberration/Distortion/Tonal ResponseNegotiableMOQ: 1 Piece
 -
Sine Image ISO 12233 Standard SFR Plus Chart 3:2 Camera Lens Test Chart Customized AvailableNegotiableMOQ: 1 Piece
-
Sine Image Reflective Photographic Paper SFR Plus Chart 223mm x 356mm Customized AvailableNegotiableMOQ: 1 Piece
-
Sine Image YE0219 Automotive Cameras Pre-distortion Test Chart Customized Available Cameras Distorted ChartsNegotiableMOQ: 1 Piece
-
Sine Image SFR Plus Chart Inkjet Resolution Predistortion Chart 10:1 & 2:1 Contrast Ratio Customized AvailableNegotiableMOQ: 1 Piece
Brand Name
Sine Image
Place of Origin
China
Model Number
YE0117
| Model | YE0117 |
| Type | Reflective/Transparent |
| Format | Custom Designs |
| Ratio | 16:9 |
PRODUCT DETAILS

Send Inquiry to This Supplier

* Email
Want the best price?
Post an RFQ now!

Business Type
Manufacturer
Year Established
1998
Factory Size
1,000-3,000 square meters
Annual Export Value
Above US$100 Million
You May Also Like
-
Sine Image SFR Plus Chart Inkjet Resolution Predistortion Chart 4:1 Contrast Ratio Customized AvailableNegotiableMOQ: 1 Piece
-
Sine Image ISO 12233 Enhanced HD Resolution Chart for Digital Camera Customized AvailableNegotiableMOQ: 1 Piece
-
Sine Image ISO 12233:2014 Standard Camera Lens ESFR (Edge SFR) Test Chart Customized AvailableNegotiableMOQ: 1 Piece
-
Sine Image ISO 12233:2014 Enhanced ESFR (Edge SFR) Test Chart for Camera Lens Customized AvailableNegotiableMOQ: 1 Piece
-
Sine Image ISO 14524 Standard Camera Contrast Chart Customized AvailableNegotiableMOQ: 1 Piece
-
Sine Image ISO 15739 Digital Camera Noise Test Chart Customized AvailableNegotiableMOQ: 1 Piece
-
Sine Image YE0269 High Dynamic Range (HDR) 36 Level Test Card Transparent Test ChartNegotiableMOQ: 1 Piece
-
Sine Image YE0223 HDTV Gray Scale Test Chart for Camera Mobile Phone Lens Halftone Reproduction Testing (D = 0.75)NegotiableMOQ: 1 Piece
-
Sine Image YE084 ITE Grayscale Chart II for Camera Mobile Phone Lens Halftone Reproduction Testing (D = 0.65)NegotiableMOQ: 1 Piece
-
Sine Image YE083 ITE Grayscale Chart I for Camera Mobile Phone Lens Halftone Reproduction Testing (D = 0.62)NegotiableMOQ: 1 Piece


