

Comprehensive Analysis of the 215D Visual Test Chart: Enhancing Visual Acuity Assessment and Diagnostic Accuracy in Optometry


Product Spotlights
Related Products
-
 Low Price Near Vision Tester NV-100 Led Mulity- Function Visual Acuity ChartsUS$ 66 - 89MOQ: 1 Piece
 -
Ophthalmic LED Vision Chart 19 Inch Screen Test Chart Optical Shop 185BUS$ 180 - 200MOQ: 1 Piece
-
VC-3 Screen Vision Chart Panel Led Visual Acuity Testing Chart 19 Inch Eye Vision Ophthalmic LCD Optical Tester MonitorUS$ 180 - 220MOQ: 1 Piece
-
Hot VC-5 Screen TV Set 19 Inch LCD Optical Vision Chart MonitorUS$ 200 - 220MOQ: 1 Piece
-
C901 Top Quality Optometry Led Vision Tester Visual Acuity Chart Ophthalmic EquipmentUS$ 880 - 900MOQ: 1 Piece
Features:
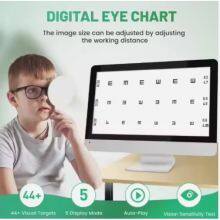
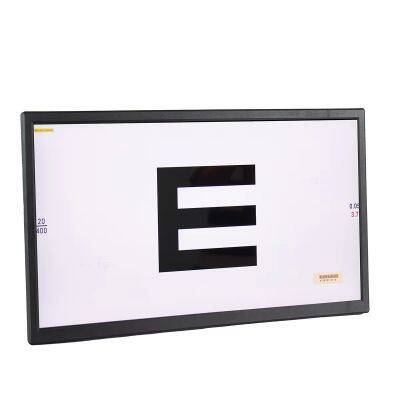
An eye chart is a chart used to measure visual acuity. Eye charts are often used by health care professionals, such as physicians or nurses, to screen persons for vision impairment. Ophthalmologists, physicians who specialize in the eye, also use eye charts to monitor the visual acuity of their patients in response to various therapies such as medications or surgery.
The eye test chart is placed at a standardized distance away from the person whose vision is being tested. The person then attempts to identify the symbols on the chart, starting with the larger symbols and continuing with progressively smaller symbols until the person cannot identify the symbols. The smallest symbols that can be reliably identified is considered the person's visual acuity.
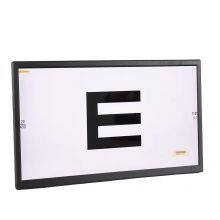
The Snellen chart is the most widely used. Alternative types of eye charts include the logMAR chart, Landolt C, E chart, Lea test,Golovin–Sivtsev table, the Rosenbaum chart, and the Jaeger chart snellen chart.
Specifications
Power supply: AC100V to 240V, 50/60Hz
Standard power: Approx. 60W
Standby power: Approx. 2W
Dot pitch of monitor: 0.282mm
Type of monitor: TFT
Size of monitor:19 inch
Ratio of monitor: 16:9
Working distance: 1m to 6.5m
Recording methods of vision: Decimal & Imperial fraction
Control distance: not less than 8M for maximum
Installation: Table support and Wall mount are all included

Send Inquiry to This Supplier


You May Also Like
-
CM-1900C 23 Inch LED Visual Acuity Panel Eye Chart Vision Testing ChartUS$ 720 - 750MOQ: 1 Piece
-
Eye Charts 20 Feet Low Vision Eye Test Charts for Eye ExamsUS$ 5 - 15MOQ: 1 Piece
-
Linear Mirror Binocular Status Check Eye Position Screening Vision Examination Inhibition Monocular Retinal DeviatioUS$ 85 - 95MOQ: 1 Piece
-
Popular Ophthalmic Portable Metal Worth 4 Dot Test Light W4LT With Red Green Glasses Torch Type Penlight Ophthalmology TesterUS$ 45 - 55MOQ: 1 Piece
-
Direct Sales 1Pcs Torrington Block Phoria Strabismus AC/A Optometry Test ToolsUS$ 30 - 40MOQ: 1 Piece
-
New Ophthalmic Vision Stereo Tester the Frisby Stereotest Randot Optometry ToolsUS$ 55 - 65MOQ: 1 Piece
-
2024 Far Near Vision Standardized Eye Chart Visual Testing Pocket Eye Chart, Snellen Pocket Eye Chart Rosenbaum PocketUS$ 15 - 20MOQ: 1 Piece
-
Waterproof Snellen Eye Chart Standard Visual Testing Acuity Chart Measure Adults Kids Eye Vision ExamUS$ 5 - 8MOQ: 1 Piece
-
Premium Snellen Eye Chart Wall Chart Plastic Waterproof Snellen Charts for Eye Test Exams 10 Feet 9 X 14 in Eluxe Occluder PlusUS$ 15 - 20MOQ: 1 Piece
-
100pcs Blue Light Test CardUS$ 7 - 8MOQ: 1 Piece


