

CDAC DIMENSION
Related Products
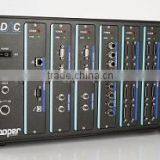
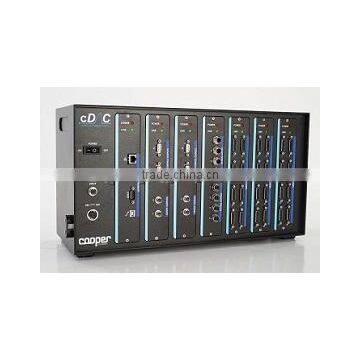
cDAC, our next generation digital controller is unparalleled in the field. Combined with our flagship universal test software, DIMENSION, provided you with the ease of use and flexibility required for testing without limit for the next 20 years and beyond
cDAC is Cooper Technology’s next generation digital data acquisition and control unit which when brought together in alliance with our flagship DIMENSION software gives you the power to perform the most demanding of tests with your materials testing equipment. Through many years of experience in the design and manufacture
of materials testing equipment, Cooper Technology have designed both cDAC and DIMENSION with the ease of use and reliability required for standard testing, and the flexibility and advanced capabilities required for research.
cDAC Key Features
General
- A Configurable design to meet your needs with up to 7 modules (max. 4 of each type) from the following per cDAC unit: Interface, Acquisition, Digital, Servo
- Integral SIL-4 safety relay to ensure the highest level of user safety
- Universal input (110 to 264)VAC, (47 to 63)Hz, 250W power supply
Interface Module (only 1 required)
- 100Mbit/s Ethernet TCP/IP and UDP connection to PC provides for fast and robust communications
- RS232/422/485 serial port for connection to environmental chambers and other ancillary equipment
- USB port for direct data logging
- Atmel AT91SAM Smart ARM-based Microcontroller for high performance
Servo Module
- Dual 5kHz control loops per module
- 0.01 to 100Hz cycle frequency to meet all your testing needs
- Digital on-the-fly adjustment of all PID parameters
- Multichannel selectable feedback from any sensor (or sum of or difference between sensors) on any acquisition card
- Hardware function generator
- Bumpless transfer between control methods
- 16 bit Analogue Voltage (±10V and (0 to 10)V) and Current (±40mA, (0 to 20)mA, and (4 to 20)mA) control output for servo valve or other control device
- Texas instruments TMS320DSP digital signal processor
Digital Module
- 4 x 24V opto-isolated digital inputs with 100mA sink capacity (each can be configured as counters)
- 4 x 24V opto-isolated digital outputs to drive auxiliary hydraulic/pneumatic solenoid valves with 1.6A drive capacity per channel (each can be configured as a PWM source)
- NXP LPC2148 ARM7TDMI-S based highperformance 32-bit RISC microcontroller
Acquisition Module
- Any combination of up to 8 sensors per module (load cells, LVDTs, RTDs, strain gauge bridges, pressure transducers, and many, many more)
- TEDS (Transducer Electronic Datasheet) sensors for plug and play measurement
- Synchronous acquisition of all sensor measurements from all modules to eliminate data-skew
- Multiple segment 5th order polynomial linearization of sensors for supreme accuracy
- 24-bit resolution on all channels
- 5kHz acquisition rate per channel
- Anti-alias filters to prevent high frequency interference
- Auto-ranging amplifiers with the following gain steps: 1/8, 1/4, ½, 1, 2, 4, 8, 16, 32, 64, 128
- (0 to 10)V, 24V, and (0 to 20)mA power supplies for sensors
- Texas instruments TMS320DSP digital signal processor
DIMENSION Key Features
Profile Builder
Choose from standard predefined test routines for simple, reliable configuration and testing to Local, National and International standards or, design and store custom routines with multiple stages where each of the following can be varied:
- Pick your analysis method for each transducer from the Analysis Dropbox (e.g. Sinusoidal Regression, Peak-Offset, Mean…)
- Choose your calculation from the Calculation Dropbox (e.g. EN 12697-24- 2012, AASHTO TP62…) to act upon the analysed data
- Setup your waveform: Static, Ramp, Square, Triangle, Sawtooth, and Arbitrary (1024 datapoints can be loaded directly from a Microsoft™ excel or text file).
- Choose your control transducer for the hardware PID loop
- Choose your control method from the Control Dropbox – allows for cascade control via any Analysis or Calculation parameter and many other advanced control methods
- Setup limits for each transducer to ensure their safety in the event of specimen failure
- Select your stage end criteria: Cycles/Time, Transducer Value, Failure (set your percentage and threshold)
- Setup what data is logged to file and when. Raw and Summary data are independently logged to file on a time-based, cyclic and/or transducer value interval All data is logged to a text file which can be opened directly in Microsoft Excel for further analysis
- Setup hardware triggering, again on a time-based, cyclic and/or transducer value interval
- Create dialogue boxes to instruct your technicians at critical points during the test
- Setup manual control stages for initial setup and user interactive parts of the test
- Choose your report template from the Report Dropbox to generate a pdf report at the end of the test
Hardware Database
- Store, access, and edit all your hardware information:
- Transducer Calibration Data with TEDs (Transducer Electronic DataSheet) interface to read all setup information directly from the embedded TEDs chips on all connected transducers.
- Servo Card Setup allows configuration to match your specific hardware.
- Digital Card Setup to configure hardware triggers, control valves, switch inputs etc.
- Acquisition Card Setup for input channel configuration
Main Test Screen
With all the information and control you need during the testing phase:
- Stage indicator shows the configuration of all test stages and indicates the current stage
- Transducer indicator shows the current average value of each active transducer
- Analysis indicator shows the current value of each value given by all transducer analysis routines
- Calculation indicator shows the current value of each calculation output
- Waveform graph shows the current cycle for any attached transducer(s) in realtime
- Summary chart shows the entire history of Analysis and Calculation outputs through the current test stage again in real time
- X-Y Waveform graph allows transducer waveforms to be plotted against another transducer for a real-time view of hysteresis
- X-Y Summary chart gives the you the flexibility to see the relationship between one parameter and another during the test e.g. force-extension, temperature extension,temperature-force
- Limits monitor gives an indication of all transducers and their value relative to the limits of their range
- Skip to next stage and stop test buttons allow for manual intervention during the test
For more information visit: .uk/shop/asphalt-testing/cdac-dimension/

Send Inquiry to This Supplier

You May Also Like
-
 Endress+Hauser E+H Compact Conductivity Device Smartec CLD18-BGGENegotiableMOQ: 1 Piece
 -
Professional Nuclear Densometer With Dual-Gauge Measurement (Direct/Backscatter)US$ 2500 - 3000MOQ: 1 Set
-
Near Infrared Food Ingredient AnalyzerUS$ 11000 - 15000MOQ: 1 Unit
-
HST Spring Dyno Friction Leakage Fatigue Testing MachineUS$ 5000 - 10000MOQ: 1 Set
-
Hydraulic Plastic Flange Connections Cover Plugs SHF SeriesUS$ 0.22 - 0.28MOQ: 2500 Pieces
-
Gates 550C 550U U550 U-550 U508 U-508 Japan Unitta U-550 Belt Tension Meter New U-508 Belt Tension Meter Upgraded Version U550US$ 1 - 900MOQ: 1 Piece
-
Analytical Balanace.scale ,weichengya Laboratory SupplierUS$ 10 - 35MOQ: 10 Sets
-
Smart MD-3051 Online Density Meter With 4-20mA OutputUS$ 2,380 - 2,500MOQ: 1 Unit
-
5W-300W Sun Simulator Watt Testing 30% Off / Xenon Lamp Sun Simulator Free Sent / Sun Simulator TestingUS$ 7,500 - 10,000MOQ: 1 Set
-
New Design Measuring Meter With Best PerforanceUS$ 1,000 - 1,200MOQ: 1 Piece


